As promised earlier, here’s my more detailed supplementary take on today’s IFS Green Budget. I’ve distilled it down into six points, but obviously there’s much, much more in the actual document itself. I’d recommend
that you read the chapters on public sector pensions and pay, the 50p
rate, and child benefit, in particular, if you’re so minded — as they’re very good summaries of some complicated fiscal
areas. Anyway, here are my points:
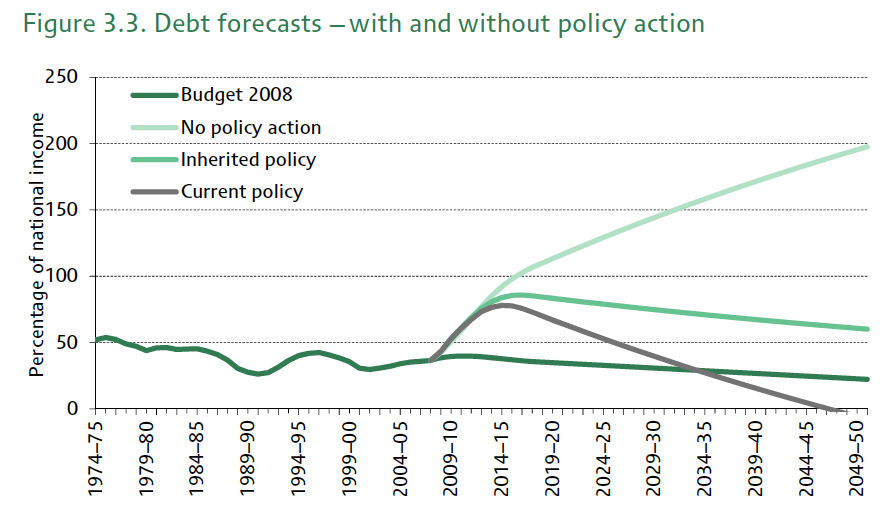
1) The scary graph. As it does every year, the IFS has produced what I call the ‘scary graph’. It shows what our debt/GDP ratio would look like for decades hence under various
circumstances. Even extending Osborne’s plans, debt will only fall back to its pre-crash levels around 2030:
And they also produced a variant of the scary graph, showing what might happen when certain considerations around an ageing population (which I’ve blogged before) are taken into account. It’s that little bit scarier:

But, of course, none of this accounts for off-balance sheet debt such as PFI. That would be the scariest graph of all.
2) The effect of a eurocrash. When the Office for Budget Responsibility delivered its own forecasts last November, it was reluctant to get into what would happen were the eurozone to crash out or split up. There was little such reluctance, today, on the part of Oxford Economics, who have done some of the forecasting for the Green Budget. On their account, even a middling sort of eurosplit could see our economy slump by almost 3 percent:

Of course, as I highlighted in the Times (£) last summer, that would have knock-on effects for the public finances, and jeopardise Osborne’s chances of meeting both of his fiscal rules (No.1, to eliminate the structural deficit within the forecasting period, and, No.2, that national debt must be falling as a percentage of GDP by 2015/16). But I was more interested by one of the graphs suggesting just how, on its own, that second rule may not tell us all that much:

Which is to say, debt would shoot up massively as a result of a eurosplit — but Osborne might still be meeting his rule to have it falling as a percentage of GDP. Not quite what he had in mind, I imagine.
3) 50p tax. I hope CoffeeHousers don’t mind another set of bullet-points, but the chapter on the 50p tax makes quite a few separate points that are worth distinguishing:
4) International aid. I hadn’t seen this chart before, so thought I’d reproduce it here. It shows Britain’s international aid spending going back to 1960, in terms of both real terms money (green line) and as a percentage of Gross National Income (black line). As it happens, we were basically at our current GNI level back when the Beatles were still cutting records together and England’s football team could win World Cups, even if the £billions being spent were much less:a) No-one knows anything. The IFS’s main point on 50p is that no-one can really be sure about its revenue raising potential yet, as we do not know, for sure, how it will affect behaviour. As they put it, ‘there is little robust evidence on how those affected have responded to the increased rate, and comprehensive evidence on this matter is unlikely to become available for some time.’ b) But HMT may still be too optimistic. That said, the chapter concludes: ‘HMT’s estimate that the new tax rate will bring in an additional £2.7 billion in a full year may be somewhat optimistic.’ The IFS base this on two considerations. First, that the Treasury has estimated the behavioural response to the 50p rate wrongly. And, second, that the Treasury hasn’t accounted for the effect of the rate on indirect tax revenues. They’re then a bit cagey when it comes to producing an overall number for what the 50p rate would raise when those considerations are taken into account — probably due to point a) above. But they do suggest that the effect on indirect taxation could mean that ‘the 50p rate raises less than £1 billion in a full year.’ And the behavioural response could, I assume, lop off even more. c) 50p is only part of a whole. A particularly striking point is that, regardless of whether 50p raises revenue or not, it still may not be the best, or ‘least harmful’, way of sucking money from the well-off. The rate, after all, is part of an overall tax system. Its revenue raising potential could be increased, for instance, if various tax avoidance loopholes were closed off. Or it could be that a different tax altogether would fit better in the current system. d) The government’s review won’t clear anything up. George Osborne, of course, has announced a review in the 50p rate, which is due to report ahead of this year’s Budget. But will that clear up the matter? No, not at all, says the IFS. In their words: ‘tax records for just one year after the introduction of the 50p rate are unlikely to provide a robust estimate of how much revenue the 50p rate will raise’.

Of course, that doesn’t address the (more moral) question of whether we should be spending this money anyway, particularly at a time of national austerity — but still worth noting, I thought.
5) Public sector pensions. The IFS released their chapter on public sector pensions yesterday, perhaps because it contains a few newsworthy facts. The most striking of these is that the latest pension reforms may not save any money after all. The coming decline in pension costs as a proportion of national income, says the IFS, is mostly down to pre-existing Labour reforms, such as increasing the national pension age, and the coalition’s decision to link pensions to CPI, rather than RPI, inflation. The money-saving potential of subsequent reforms has been undone by ‘decisions over the rates of accrual and indexation’.
The IFS stress that this doesn’t mean that the latest reforms are pointless: they remove various inconsistencies from the system. And they add that, ‘Public sector workers will still have much more generous pensions than those typically available to their private sector counterparts’.
6) Child benefit. The chapter on child benefit will be among those read most closely by the government, I’m sure. It highlights one of the problems with the government’s current policy of withdrawing the benefit from higher-rate-taxpaying individuals: the ‘cliff face’ whereby some people would effectively be better off by earning less than higher-rate taxpayers and keeping their child benefit. And the IFS also offers a few ways of smoothing out that ‘cliff face’, much as the government is planning to do.
Their preferred method, it seems, revolves around wrapping child benefit in with child tax credits, and withdrawing both against the joint income of a couple — not least because this would also remove the inconsistency by which ‘a couple where each adult had an income of £42,000 per year would not lose any child benefit, whereas a couple with one individual with an income of £43,000 would lose all of their child benefit’. The two lighter green lines, below, show how that could work (the darker green line is the current ‘cliff face’):

These plans would, of course, raise less money for the Exchequer than the current ‘cliff face’ option, but still more than not withdrawing child benefit at all.


Comments