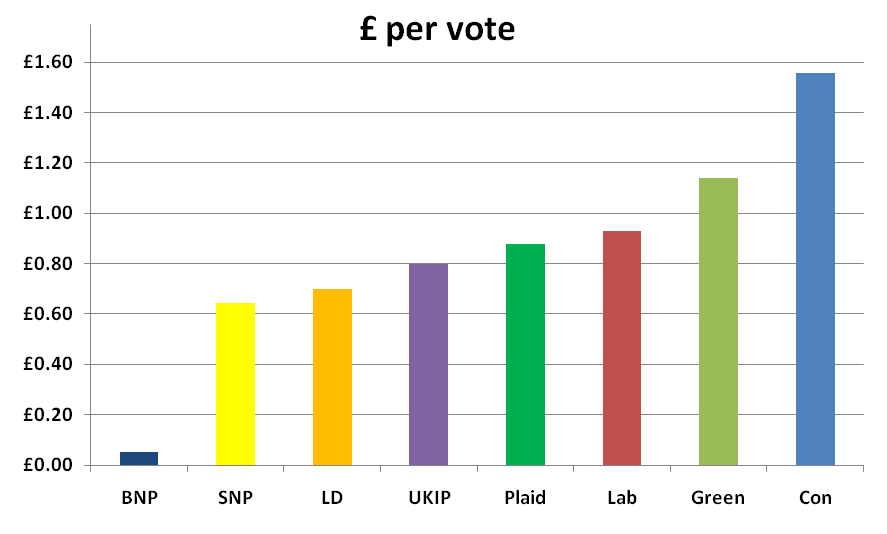
Coffee House has wrung today’s party expenditure figures through the calculator to produce the colourful graphs below. As the headings suggest, they show how much was spent by each party* for every individual vote and seat they won in the general election:


*That is, each party that received over 100,000 votes. Excluding Northern Ireland-based parties.

Britain’s best politics newsletters
You get two free articles each week when you sign up to The Spectator’s emails.
Already a subscriber? Log in


Comments
Join the debate for just £1 a month
Be part of the conversation with other Spectator readers by getting your first three months for £3.
UNLOCK ACCESS Just £1 a monthAlready a subscriber? Log in