We’re used to seeing growth forecasts for the next few years, but here’s an altogether rarer beast: forecasts stretching all the way to 2050. They were released by PricewaterhouseCoopers last night, and I thought CoffeeHousers might appreciate seeing them in graph form. Naturally, slap health warnings aplenty across this – economists barely know what will happen this year, let alone decades hence – but some of the trends are still pretty striking. Here’s a round-up:
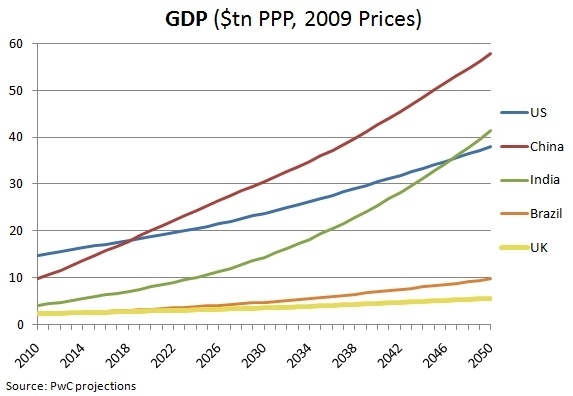
1. This first graph suggests that – allowing for the relative values of different currencies – China’s GDP will top the US’s around 2020. India’s does likewise just before the 2050 endpoint:

2. The picture for each country’s GDP as a percentage of the world economy is more eye-catching still. Here, the US drops consistently from now until 2050, while China and India rise inexorably:

3. But it’s not all about China and India overtaking the West. When it comes to GDP per capita, both countries lag severly behind the US – and even the UK – until 2050 and, one assumes, well beyond:

4. Finally, the average annual growth experience by each country. The UK hovers just over the 2 percent mark – which is what most forecasters envision for this year alone – while countries like China, India, Nigeria and Vietnam are at two-to three-times that:


Comments