
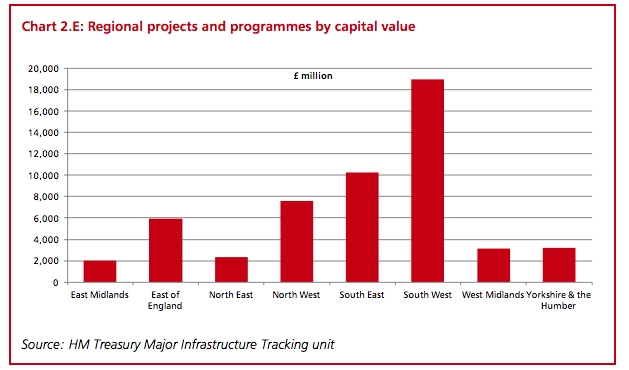
The chart at the top of this post comes from the government’s National (sic) Infrastructure Plan 2013. (Sic because it is largely a plan for England.) You can find it on page 30. You may notice that one rather large part of England is not listed on this chart: London.
Perhaps that is because the value of infrastructure spending in London comes in at a nifty £36 billion. Or, to put it another way, spending on infrastructure in London is equivalent to the total amount of infrastructure spending in every other part of England save the south-west. And the south-west’s figure is chiefly so high because of a single project: the new nuclear power station at Hinckley Point.
Ed Cox, from the IPPR, tweeted that the per capita spending on transport infrastructure comes out at: south-west £215, north-east £246, Yorkshire and Humberside £303, north-west £839, London £4895.
Now you may say there is nothing wrong with that and, to some extent, I would agree with you. London has special needs. London also, of course, is the British economy’s greatest engine. And to remain so it needs major improvements to its infrastructure. By their very nature these will be extremely expensive projects. (And a huge percentage of all rail trips are in London.)
All of that is fine. Everyone in the rest of the United Kingdom can, I think, understand all this. We also understand that money earned in London is sometimes redistributed elsewhere.
Nevertheless, you do wonder sometimes. You wonder, for instance, if London’s need is really so much greater than needs elsewhere. Since infrastructure spending is such a vital contributor to economic growth in London, you wonder if it might not also be quite important in other parts of England. You wonder if spending £64 billion in southern England but only £23 billion in the rest of England quite gets the balance right. You wonder how much easier it seems to be to spend money in some parts of the country than in others.
Noting that London enjoys a capital bonus in every sense of the term is not the same as arguing that London has no need for this spending. But, again, the regional disparity is striking. It reminds us, if we needed reminding, that policy-thinking and policy-making are often London-centric to a degree that might be thought both unfortunate and unwise. (Might an east-west high-speed rail linking the great cities of Lancashire and Yorkshire be better for those cities than faster links to London? I don’t know. I only ask.)
It is, I think, sometimes forgotten – at least by folk in politics and the media – how much London benefits from being the seat of government, culture, finance and the press. It is, for sure, a great and glorious city but it enjoys certain institutional advantages denied other parts of England. Not the least of these is an inbuilt – and perhaps hard to avoid – policy bias that makes London’s needs loom especially large in the political imagination.
I wouldn’t go so far as to suggest Londoners are subsidy junkies. That would be unfair and also not quite correct. Nevertheless, the figures are striking.


Comments