
Rising inflation has grabbed headlines across the globe over the past year, reaching multi-decade highs in many countries in the past several months. From petrol prices to food and travel, inflation has impacted nearly every corner of consumers’ lives. With inflation at such high levels, many people are asking what – if anything – can be done to tame these sizeable price increases. In this article, Fisher Investments UK looks at where inflation is today, where it could go from here and potential benefits of equity ownership during inflationary periods.
Where is inflation today?
Inflation is a normal economic phenomenon. In fact, central banks around the world typically target a small amount of inflation each year – usually around 2%. However, the current environment has far exceeded these targets. In the United States, the Consumer Price Index (CPI) – a commonly used measure of inflation – reached 9.0% year-over-year in June (Exhibit 1), and has since decelerated to 8.3% year-over-year in August. In July, the UK hit a new 40-year high CPI headline inflation of 10.1% year-over-year, before coming down slightly to 9.8% year-over-year in August. The eurozone notched a record high 9.1% year-over-year CPI reading in August.[i]
Fisher Investments UK knows that inflation hasn’t hit the globe uniformly. Whilst much of the western world has experienced high inflation, China and Japan have seen much lower inflation by contrast. Some of this can be attributed to demand destruction in China amid lingering COVID lockdowns. Meanwhile, the Bank of Japan has long battled deflation and a large portion of the recent rise can be attributed to higher energy prices.
Exhibit 1: headline inflation spikes are widespread
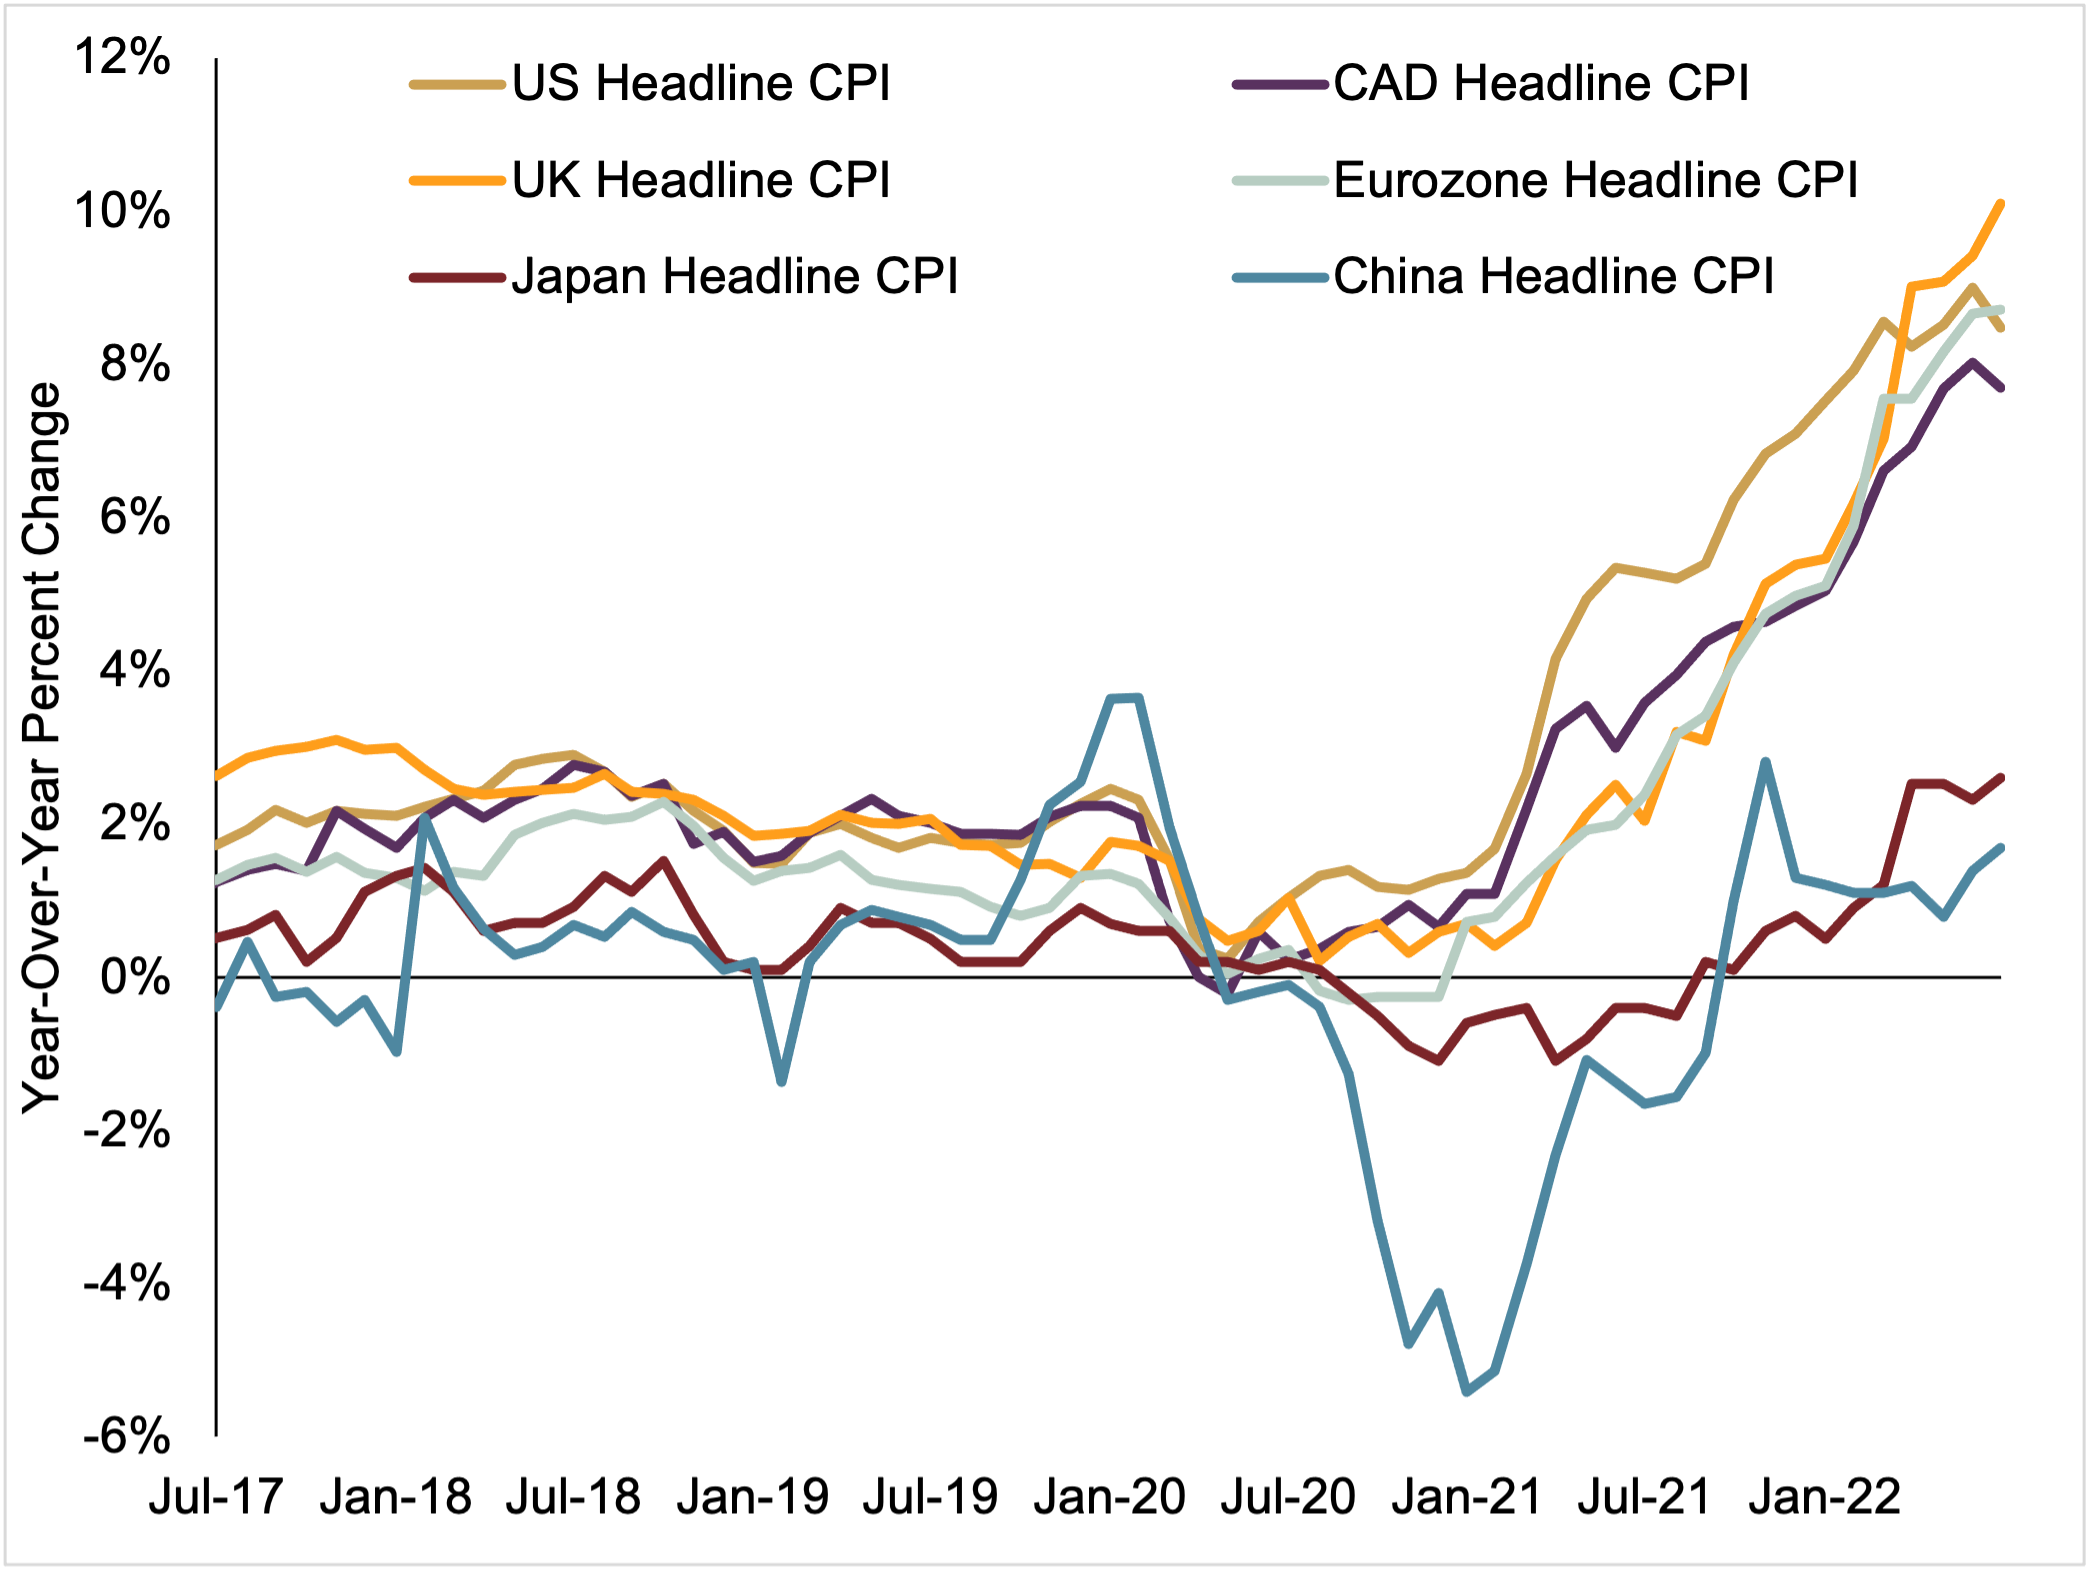
Source: FactSet, as of 09/14/2022. US, Canada, UK, Eurozone, Japan, and China Y/Y headline CPI, monthly, seasonally adjusted, 06/30/2017 – 07/31/2022.
Because food and energy prices can be volatile in the short-term, some investors focus only on core inflation, which excludes these categories. Proponents of this approach believe core inflation is more indicative of inflation trends across the economy. Exhibit 2 shows how core inflation numbers actually moderated to some degree in the US, UK and Eurozone as 2022 progressed. Still, core inflation remains elevated and it’s difficult to tell where it will go in the near term.[ii]
Exhibit 2: core inflation numbers elevated less extreme
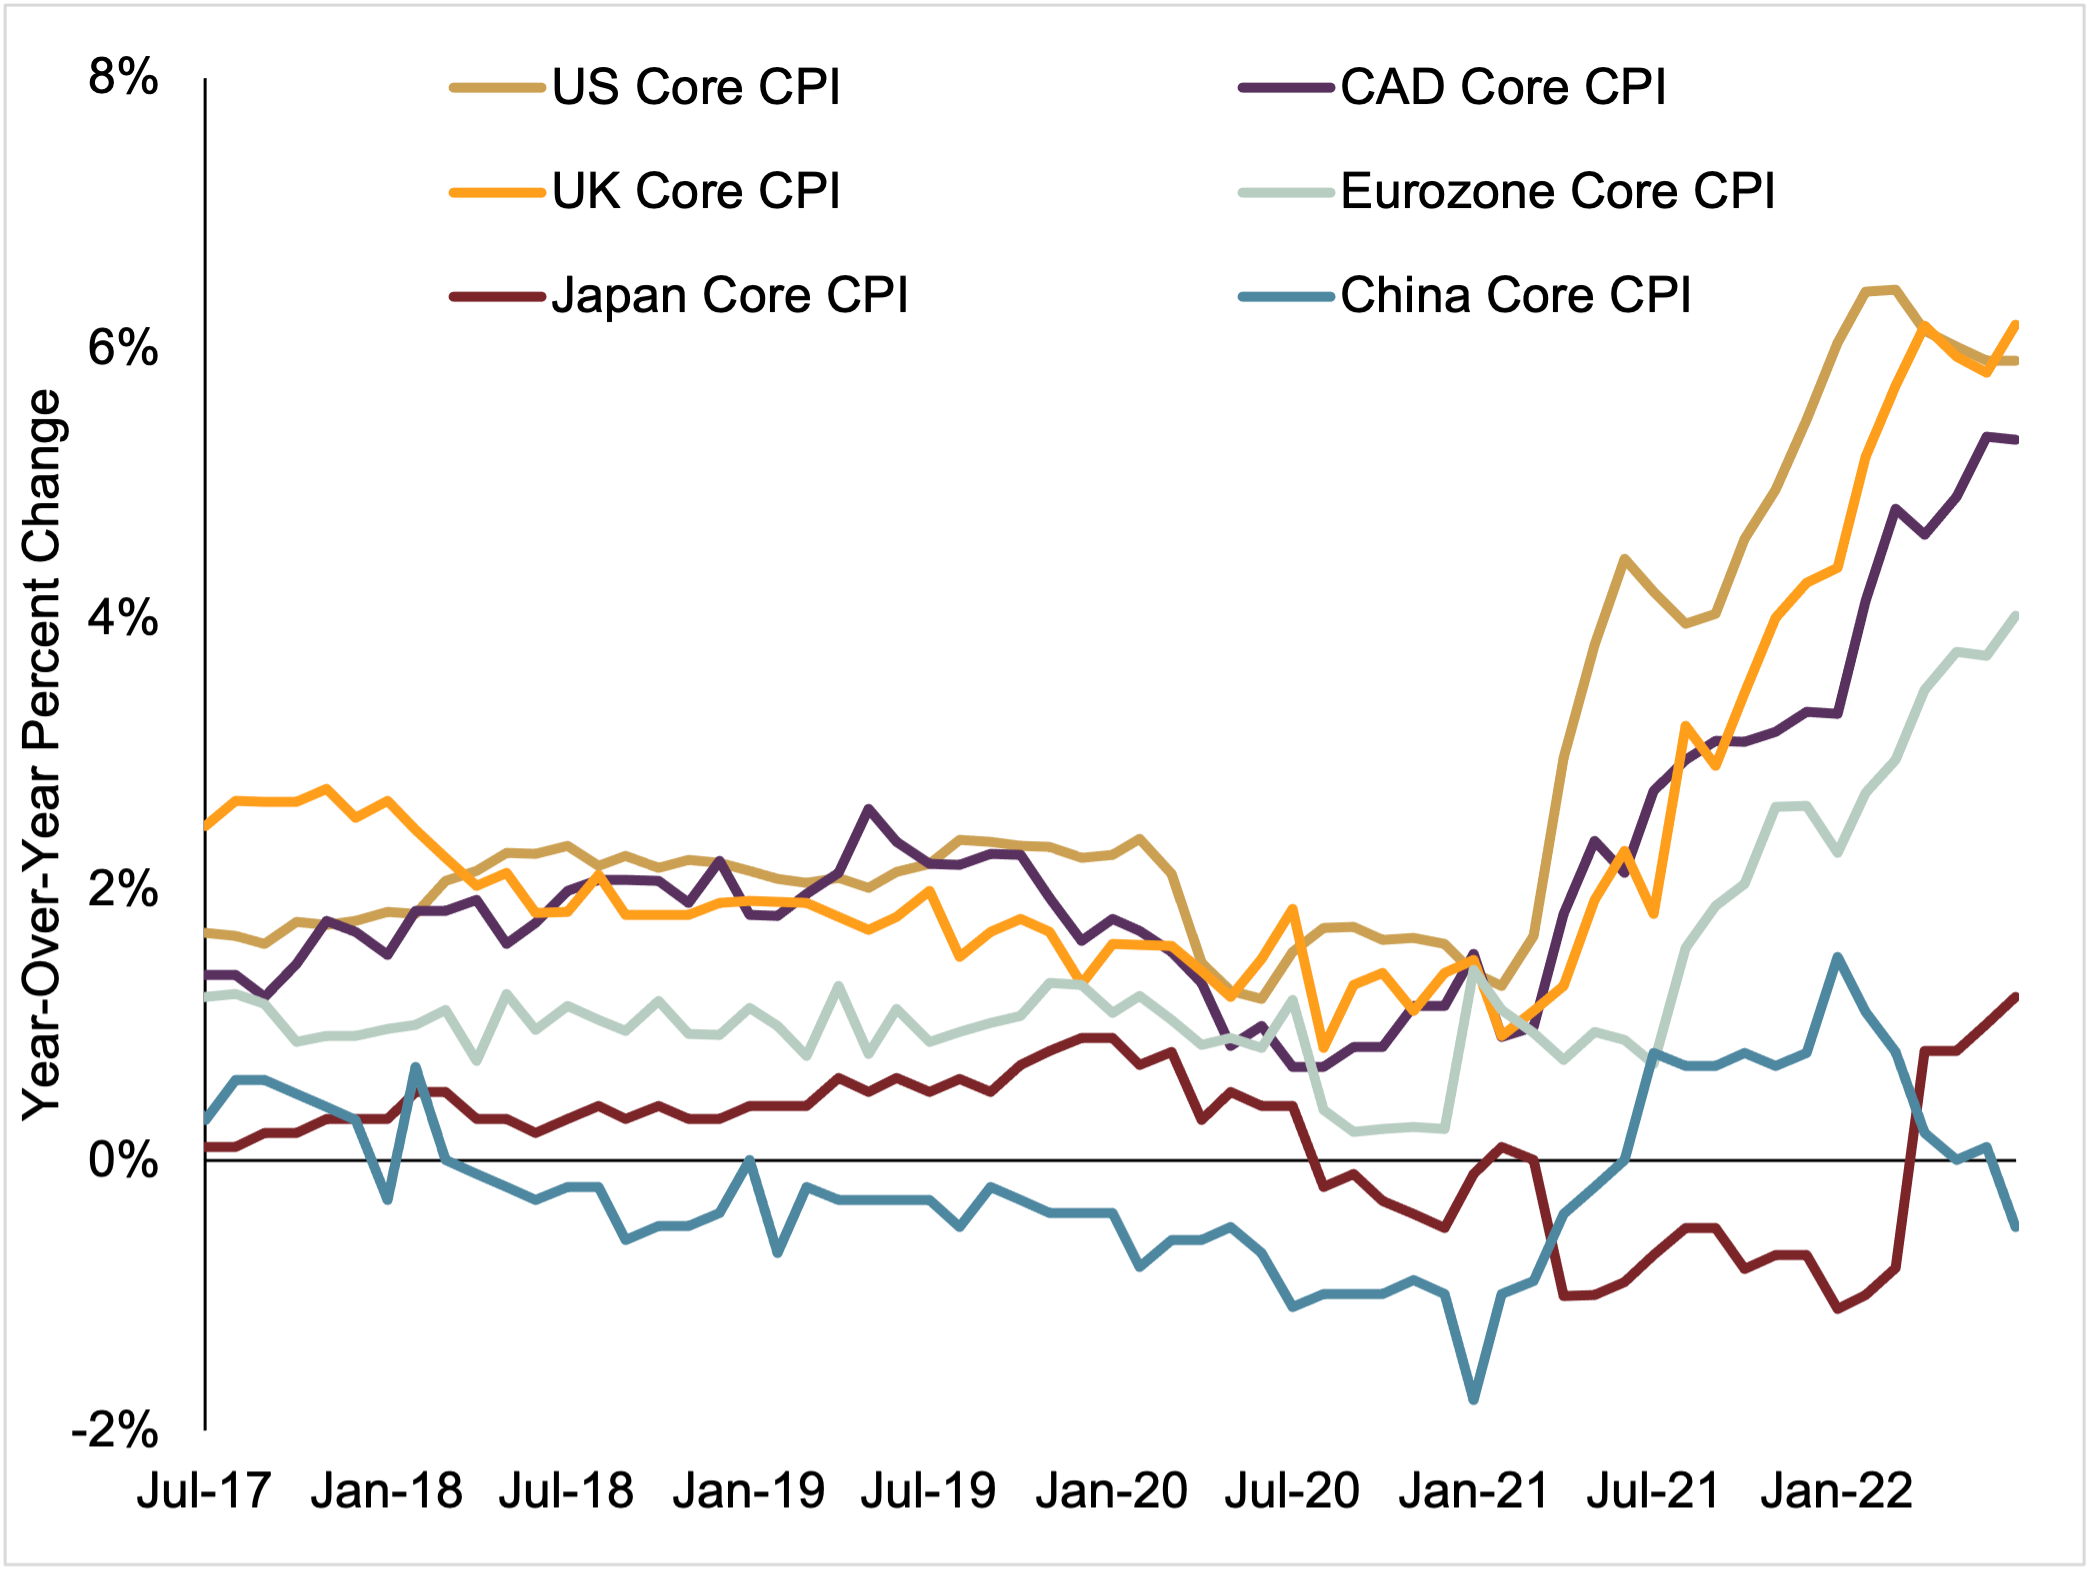
Source: FactSet, as of 09/14/2022. US, Canada, UK, Eurozone, Japan and China Y/Y core CPI, monthly, seasonally adjusted, 01/31/2020 – 07/31/2022. US, Canada, Japan and China Core CPI excludes food and energy prices. UK and Eurozone Core CPI excludes energy, food, alcohol, and tobacco prices.
What has caused high inflation?
Fisher Investments UK shares Nobel prizewinning economist Milton Friedman’s view that inflation is driven by too much money chasing too few goods and services. Let’s take a closer look at how this applies to the trend of rising inflation over the past 18 months:
- Supply chain issues: global supply chain bottlenecks following COVID related lockdowns were – and to some extent continue to be – a main contributor to inflationary pressures. From well-publicised semi-conductor shortages hampering production of automobiles and electronics products to lumber shortages and global shipping delays, supply chain issues have persisted since 2020. Reduced availability of goods during a period of generally rising demand have resulted in rising prices. Thankfully, there are strong signs of easing supply chain pressures and falling transportation costs.
- Consumption pattern shifts: travel restrictions and lockdowns limited the way people could spend money. Many developed economies are more services orientated, but lockdowns caused a change in consumer spending towards goods during a period of ongoing supply disruptions. This pandemic-induced shift exacerbated supply chain issues and led to shortages. This pattern has begun to normalise, with a shift back towards services spending, as economies reopened.
- Surging re-opening demand: a rapid increase in demand, particularly for travel and leisure services—hit hard by COVID restrictions – along with elevated supply costs and labour shortages have contributed to rising services prices. For example, the airline industry stopped recruiting staff and reduced their fleets due to COVID lockdowns. Airlines have since struggled to bring the same capacity back online due to labour shortages, which has contributed to the widely publicised travel disruptions and higher airfares Fisher Investments UK sees today.
- Higher energy costs: increasing demand for oil – initially decimated during early COVID lockdowns – stretched supply as economies re-opened, raising prices. The Russia-Ukraine conflict exacerbated oil and gas supply issues causing prices to soar in spring of 2022. Some countries – such as the US and some OPEC nations (also known as “Organisation of the Petroleum Exporting Countries”), are ramping up production, but it takes time to increase capacity. Furthering the energy crunch is reduced refinery capacity across the globe, with several refineries shuttered during the early stages of the pandemic largely due to low demand and rock bottom energy prices at the time. Prices have since fallen from their 2022 highs, but supply issues persist in certain parts of the world where energy costs remain particularly elevated.
- Russia-Ukraine war: the tragic invasion of Ukraine by Russia in late February exacerbated an already rising oil market. In response to the invasion, many Western economies levied sanctions against Russian energy trade – the biggest part of its economy. Russia has also hit back and reduced pipeline flows to some European nations. This has further contributed to higher energy costs, though the global impact of sanctions has been less than originally feared. For example, sanctions have not kept Russian oil entirely off the market. Non-sanctioning countries like China and India have been willing buyers of Russian oil, sometimes at big discounts.
Can central banks slow inflation?
Fisher Investments UK knows that people often look towards central banks – which largely exist to provide price and labour stability – to slow the rate of inflation to more acceptable levels. One “tool” used by central banks when battling inflation is hiking short-term interest rates. Many central banks, including the European Central Bank, the Bank of England, and the US Fed, have raised short-term rates this year. These adjustments to short-term rates can affect the yield curve – a graph that plots interest rates of bonds with differing maturity dates – and indicate if the ability to borrow money is getter harder or easier. Why is that?
The yield curve can be a good proxy for bank lending. Banks borrow at lower, short-term rates and lend at – typically – higher long-term rates, earning profit from the difference between these two rates. Thus, the yield curve is a decent indicator of banks’ incentive to lend. If central banks hike short-term rates too aggressively, it could result in short-term rates exceeding long-term rates – referred to as a yield curve inversion. This scenario can reduce banks’ profits on new loans, discouraging further lending.
Central banks hike short-term rates hoping to slow economic activity to tame inflation without crippling the economy – a tricky balancing act. Lower bank lending leads to less credit availability for businesses and consumers, ultimately hurting economic activity. But when central banks react rashly to rising inflation, the potential for a policy misstep rises, as does the resulting chance of recession.
Fisher Investments UK notes that the challenge that central banks face is that monetary policy can only do so much to effectively tame inflation. It can’t bring new energy sources or supplies online, fix supply chain bottlenecks, end wars or ease COVID restrictions. It is difficult to know when inflation will peak, but one thing is fairly certain – corporations, and not central banks, are more likely to gradually help dampen inflation.
Where do we go from here?
It’s difficult to know whether inflation’s peak is behind us, but it should abate over time. For example, signs point to supply chains easing, global transportation networks normalising, and economic growth appears better than feared. Whilst it has taken time, companies have responded to higher prices and demand, increasing production of everything from semiconductors to oil. This should gradually offer some inflation relief. Of course, time required to bring new supply on line can vary, so shortages may still persist in certain areas.
Another factor likely contributing to slowing price growth is the base effect, which can skew the year-over-year change. The base effect is something Fisher Investments UK has long eyed as a likely disinflationary force this year. Year-over-year inflation rates measure the percentage change between prices in one month and that same month a year prior. The “base” is that year-ago price level, which is the denominator in the calculation. Grade school fraction lessons tell us a higher denominator can result in a smaller quotient – and vice versa.
In the US, up until April of 2021, the base inflation number was compared to a lower denominator due to deflated prices from early 2020’s lockdowns. Prices’ autumn 2021 rise will raise the calculation base over the rest of the year. In Europe and elsewhere, this base effect is also likely to be more impactful as we move into 2023. Regardless, unless prices continue jumping from month to month, the higher base should help year-over-year rates moderate.
How can investors help mitigate inflation?
Many investors fear inflation’s impact – rising costs can greatly impact peoples’ lives and retirement plans. But for investors, Fisher Investments UK notes, that inflation isn’t inherently bad for equities, which have actually done well amid rising inflation in the past. Exhibit 3 evaluates every month where the US CPI inflation rate was above 3% y/y, 4% or 5% since 1969 and the MSCI World Index corresponding equity returns over the next 6, 12 and 18 months. All of the median return figures are positive, which indicates higher-than usual inflation isn’t automatically negative for equities. Additionally, this table shows that equities’ inflation-adjusted returns are still typically positive during these periods.[iii]
Exhibit 3: equities typically offer a hedge against high inflation*
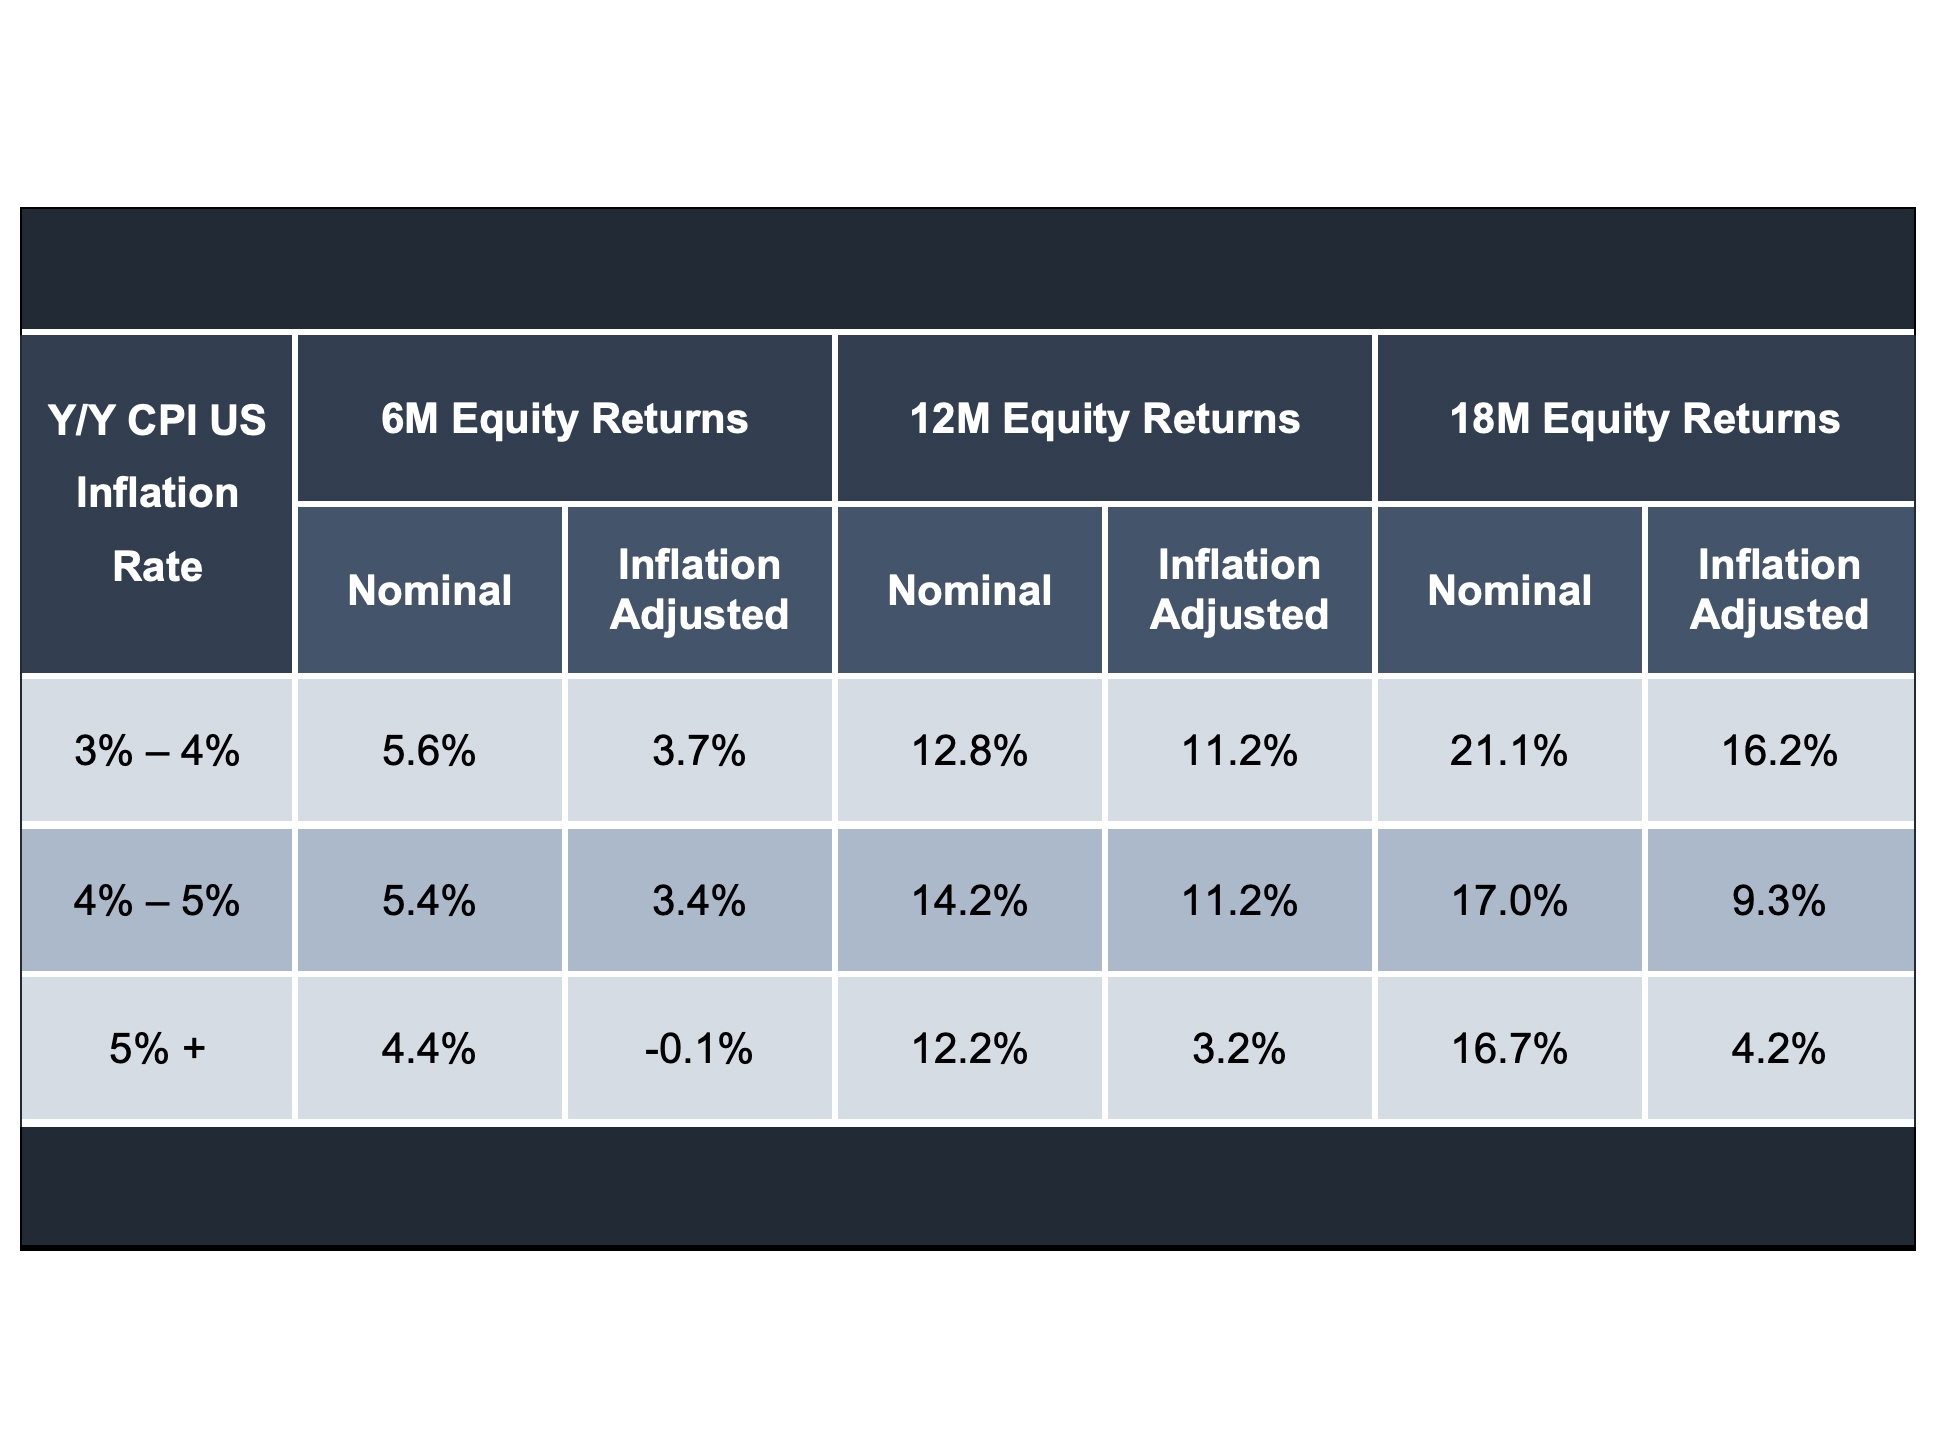
Source: FactSet, as of 04/27/2022. MSCI World Total Return Index, 12/31/1969–03/31/2022; y/y US CPI change, monthly, 12/31/1969–03/31/2022. 6, 12 and 18-month returns are cumulative, not annualised. Presented in US dollars.
Whilst it’s impossible to pinpoint when the current inflationary environment will ease, many inflation drivers have shown signs of improvement. In the meantime, Fisher Investments UK believes equities’ ability to outpace inflation over time can help long-term investors hedge against inflation’s bite.
Get exclusive equity market knowledge in your Markets Commentary guide as the first of our ongoing insights.
Follow the latest market news and updates from Fisher Investments UK:
Facebook: https://facebook.com/FisherInvestmentsUK/
Twitter: https://twitter.com/FisherInvestUK
LinkedIn: https://www.linkedin.com/company/fisher-investments-uk
This document constitutes the general views of Fisher Investments UK and should not be regarded as personalised investment or tax advice or a reflection of client performance. No assurances are made that Fisher Investments UK will continue to hold these views, which may change at any time based on new information, analysis or reconsideration. Nothing herein is intended to be a recommendation or forecast of market conditions. Rather, it is intended to illustrate a point. Current and future markets may differ significantly from those illustrated here. In addition, no assurances are made regarding the accuracy of any assumptions made in any illustrations herein. Fisher Investments Europe Limited, trading as Fisher Investments UK, is authorised and regulated by the UK Financial Conduct Authority (FCA Number 191609) and is registered in England (Company Number 3850593). Fisher Investments Europe Limited has its registered office at: Level 18, One Canada Square, Canary Wharf, London, E14 5AX, United Kingdom. Investment management services are provided by Fisher Investments UK’s parent company, Fisher Asset Management, LLC, trading as Fisher Investments, which is established in the US and regulated by the US Securities and Exchange Commission.
Investment management services are provided by Fisher Investments UK’s parent company, Fisher Asset Management, LLC, trading as Fisher Investments, which is established in the US and regulated by the US Securities and Exchange Commission. Investing in financial markets involves the risk of loss and there is no guarantee that all or any capital invested will be repaid. Past performance neither guarantees nor reliably indicates future performance. The value of investments and the income from them will fluctuate with world financial markets and international currency exchange rates.
[i] Source: FactSet, as of 09/16/2022. US, UK, Eurozone Y/Y headline CPI, monthly, seasonally adjusted, 06/30/2021 – 08/31/2022.
[ii] Source: FactSet, as of 09/14/2022. US, Canada, UK, Eurozone, Japan and China Y/Y core CPI, monthly, non-seasonally adjusted, 06/30/2021 – 07/31/2022. Core CPI excludes food and energy prices.
[iii] Source: FactSet, as of 04/27/2022. MSCI World Total Return Index, 12/31/1969–03/31/2022; y/y US CPI change, monthly, 12/31/1969–03/31/2022. 6, 12 and 18-month returns are cumulative, not annualized. Presented in US dollars.


Comments