What forces Covid into reverse? To many, the obvious answer is lockdown. Cases were surging right up until the start of the three lockdowns, we’re told. It’s often said that all else failed. The Prime Minister said on Tuesday that lockdown, far more than vaccines, explains the fall in hospitalisations, deaths and infections. But how sure are we that only lockdown caused these falls — in the first, second and third wave? Or were other interventions, plus people’s spontaneous reactions to rising cases, enough to get R below one?
In a peer-reviewed paper now published in Biometrics, I find that, in all three cases, Covid-19 levels were probably falling before lockdown. A separate paper, with colleague Ernst Wit, comes to the same conclusion for the first two lockdowns, by the alternative approach of re-doing Imperial College’s major modelling study of the epidemic in 2020. In light of this, the Imperial College claim that new infections were surging right up until lockdown one — causing about 20,000 avoidable deaths — seems rather questionable.
Let’s start with the events of last March. Imperial’s Neil Ferguson, whose modelling inspired the government’s decision to go into lockdown in March, told MPs in June that ‘had we introduced lockdown measures a week earlier, we would have reduced the final death toll by at least a half’. Last December, a paper called Report 41 was published by Imperial College along these lines. It said:
Among control measures implemented, only national lockdown brought the reproduction number below 1 consistently. Introduced one week earlier, it could have reduced first wave deaths from 36,700 to 15,700.
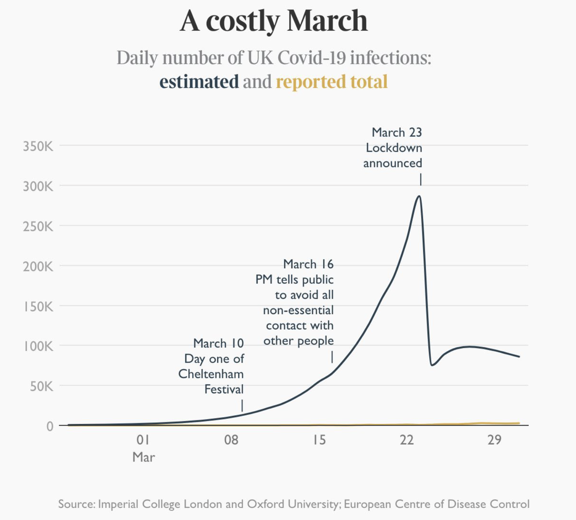
Its argument was summed up in one of the very few graphs to make it out of academia and into the newspapers, showing that infections trebled in the week before lockdown — because none of the other measures (suspending large events, work-from-home guidance, school closures etc.) apparently made any appreciable difference.

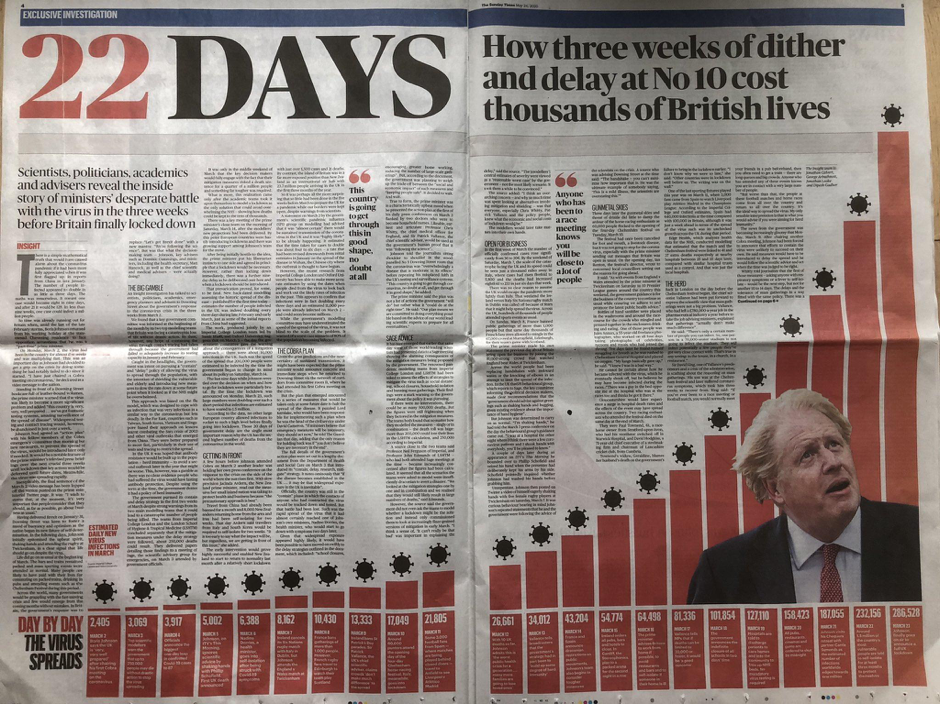
This above was reprinted over a double-page newspaper spread — with the precise number of infections every day printed at the bottom. Publicity for an epidemiological model doesn’t come much bigger.

But how sure can we be of the overall direction of the virus in the days before lockdown, let alone the precise numbers? If epidemiological models are being used to decide lockdown policy, it’s important they are robustly tested. And even more important that we work out what we know for sure — and what we don’t.
Imperial’s analysis of the March lockdown
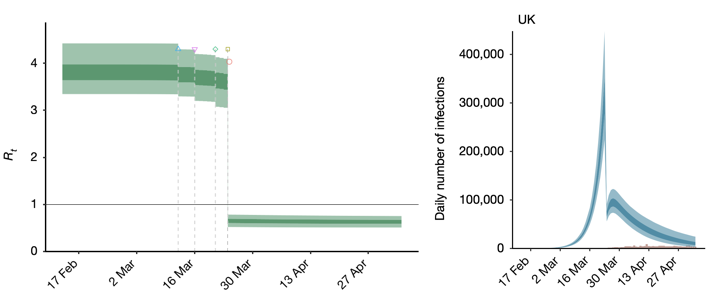
When professor Ferguson spoke in June, his analysis appeared to be boosted by a paper in the prestigious journal Nature. In it, Ferguson’s Imperial team had developed a simple model of the spread of Covid-19 and fitted it to data on the daily deaths from Covid-19. Crucially, for those critical few days and weeks around lockdown, they wanted the data to tell them how, when and by how much the R number changed. The graph they obtained is below and shows the R number in green, with uncertainty intervals. The triangles, and other symbols, mark various interventions (self-isolation, social distancing, work from home and school closures). These interventions appear to have barely any impact on the R number. But lockdown, announced late on 23 March, brings it crashing down.

The R estimates translate into surging total new infections each day (above in blue). Many graphs are produced in academia. Not many are the basis for a double-page spread in a national newspaper, as the Imperial chart was. And the interpretation that ‘dither and delay cost thousands of British lives’ is striking. But those figures were not drawn from actual measurements of the daily number of new infections. Such hard data did not, and do not, exist. Instead, the most reliable data available were on numbers of deaths each day, and the range of times from infection to death. A model is needed to turn such data into figures on daily new infections. And the model that was used contains assumptions that, in subtle but important ways, strongly favours infections surging until 23 March.
In particular, the Imperial team’s model assumed that they knew when and how R was changing. They only needed the data to tell them by how much it changed.
The data-led approach
I repeated Imperial’s analysis, but with one important difference: the data were used to also determine when and how R changed. The Imperial model then gives a very different result. It suggests that R was already below 1 before lockdown. If that is the case then, rather than surging, new infections were already in decline.
In the same paper I also used a different approach, bypassing the Imperial model altogether, to directly estimate the daily number of new fatal infections from the data on daily deaths and fatal disease duration. This direct approach also strongly suggests that infections were in substantial decline before lockdown, and that R was already below one. The graph below shows what this second approach found around the time of the first lockdown.
The same approach can be used again at the second and third lockdowns. Before the second lockdown it was argued that the tier system was ineffective and that cases were surging. But the reconstructions suggest that fatal infections — and by implication Covid infections generally — were not surging. They were in decline having peaked earlier. The third peak is between Christmas and New Year. Not, perhaps, a surprise, but remember that by December the vaccine program was underway.
It is possibly worth noting that although the estimated fatal infections were in retreat before each lockdown, the daily deaths were surging each time that a lockdown was called. The psychological pressure that this puts on the decision makers is obvious.
The approach I took of course makes its own assumptions. That the infection rate and R change in a smooth continuous manner, as people change their behaviour. My paper examines in detail whether that assumption — rather than the data — could be responsible for my conclusions. But it appears not. Further, allowing for the 5 to 6 day average delay between infection and onset of symptoms, the results in the two charts above are also consistent with reconstructions of the daily onset of new Covid symptoms from the React-2 study. (This is run by a different group at Imperial and focuses on epidemic measurement).
My work is not alone in raising concerns about Imperial’s evidence for lockdown efficacy. For example, in a forthcoming peer-reviewed paper in the Journal of Clinical Epidemiology, Vincent Chin, John Ioannidis, Martin Tanner and Sally Cripps, use the same Imperial model together with a second model, also originally produced by the Imperial group. By fitting these alternative models to the data, they show that, if anything, the data imply that lockdown had little or no benefit. At a minimum, this means that the Imperial results are not robust.
And then there is Sweden: the western European country that tried a different approach, and did not lockdown. My analysis finds that its daily infection rate started declining only a day or two after the UK, as the following plot shows.
The Imperial study does not disagree that Swedish infections declined without lockdown. In fact, to accommodate this anomaly their model treats the final March intervention in Sweden (shutting colleges and upper years secondary schools) as if it was lockdown. As many others have pointed out, that’s a strange way to model the set of data that most directly suggests that lockdown might not have been essential.
Taken together these results imply that the pronouncement that 20,000 lives would have been saved by an earlier first lockdown is wrong. In fact, it is probably an answer to the wrong question. The more interesting question remains whether lockdown was necessary at all, or whether the earlier measures might have been sufficient.
An alternative approach
This brings us back to Imperial’s Report 41 — the paper published last December that concluded that ‘only national lockdown brought the reproduction number below 1 consistently’. It fits an impressively detailed model with hundreds of equations to data on Covid-19 test results, hospital and care home deaths, hospital and ICU occupancy and hospital admissions. As with the previous Imperial study, the key question is when, how and by how much the R number had changed — this time over most of 2020.
Again as with the previous study, Report 41 assumes that the ‘when and how’ parts are essentially known, and the data need only be used to tell us the size of the R changes. The conclusion reached is that lockdowns are essential to bringing R below 1 and that deaths in the first wave could have been reduced from 36,700 to 15,700 had lockdown been called on 16 rather than 23 March.
With professor Ernst Wit of Università della Svizzera Italiana in Switzerland, I repeated the Report 41 analysis as reported in a pre-print (a not yet peer-reviewed study) on medRxiv. The Report 41 assumptions around the first lockdown are even more restrictive than in Imperial’s earlier study, and we again replaced them with an approach that allows the data to tell us when and how R changed, as well as by how much. Because far more data are involved this time, the scope for our own assumptions to bias our results is lessened, but we nonetheless took an approach designed to minimise such problems.
Checking the key assumptions used by Imperial
As we went through Report 41 we also noticed some unusual things: Imperial’s model was using key input measures that were shorter than the times given in the published papers cited as sources.
- The time Imperial used from infection to symptoms (the ‘incubation period’). It’s stated as 4.6 days, citing Lauer et al. But that study says ‘the estimated mean incubation period was 5.5 days.’ A careful subsequent analysis by McAloon et al combining several studies, including Lauer et al, gives 5.8 days.
- The time Imperial gave from symptoms to hospitalisation. Imperial give a mean of 4 days, citing Docherty et al. But that paper gives 4 days as the median time. For the model they use, the corresponding mean days from onset to hospital is 6, not 4.
These two changes subtract three days from the model time between Covid infection and hospitalisation, compared to the values given in the cited literature. This is not a small issue if so much is to be made about every day mattering.
Two other points from Imperial’s Report 41 were troubling:
- The model structure forced the average time from infection to infection to be quite a bit longer than the times reported in the literature.
- The model-fitting appeared to be set up in a way that attributed unusually low weight to the actual data, relative to assumptions built into the model.
We tried to correct each of these four issues. The resulting model and analysis are very far from perfect, but we think that the results can give a somewhat more accurate picture of what the data imply than the original. Below is the picture we got for infections, by region and in total, around the time of first lockdown. Again the results imply that infections were in retreat before lockdown was called.
Around the second lockdown, where the Imperial model is set up to be much less restrictive than around the first, the results of our re-implementation are broadly similar to Report 41: R was below one, and hence infection levels were falling (in most regions and in total), before lockdown.
So even taking the most negative view of our work, and the most positive view of the Imperial study, it is hard to see the latter as providing robust evidence for lockdown having caused R to drop below 1. Let alone as providing a reasonable basis on which to compute the number of lives that an earlier lockdown might have saved.
Even if our study’s assumptions are no better than Imperial’s, just different (which we would dispute), we have clearly shown that the Report 41 results are too strongly dependent on the model assumptions to provide reasonable evidence for the life-saving potential of earlier lockdowns claimed in the press.
But suppose that our results are discounted altogether — what then? The claims made in Report 41 are still dubious. For a start, they are based on a model that ignores hospital-acquired infections: regrettably a non-negligible part of the UK Covid epidemic.
What is not ignored by Report 41 is that the model does not and cannot distinguish the effects of government policy from other effects, such as the weather. The report is open about this, but not about its logical consequences. If we cannot even separate the effects of lockdown from the effects of weather, then it is really not possible to say what effect an earlier lockdown would have had.
So the most reasonable interpretation of the publicly available data seems to be that R was less than 1, and infections in decline, before each of the three full lockdowns to date. Measures short of full lockdown, and perhaps people’s own behavioural response to rising deaths, appear more likely to have been responsible for turning the tide of infection.
Of course, data that are not yet publicly available, in particular from the NHS and ONS, could yet alter this picture in future. But using Imperial’s figures to claim that 20,000 lives were lost because lockdown was delayed is not valid. And if lockdowns were not essential to turning the tides of the epidemic, the question remains whether they were worth the collateral damage.
This article is free to read
To unlock more articles, subscribe to get 3 months of unlimited access for just $5


Comments
Join the debate for just £1 a month
Be part of the conversation with other Spectator readers by getting your first three months for £3.
UNLOCK ACCESS Just £1 a monthAlready a subscriber? Log in