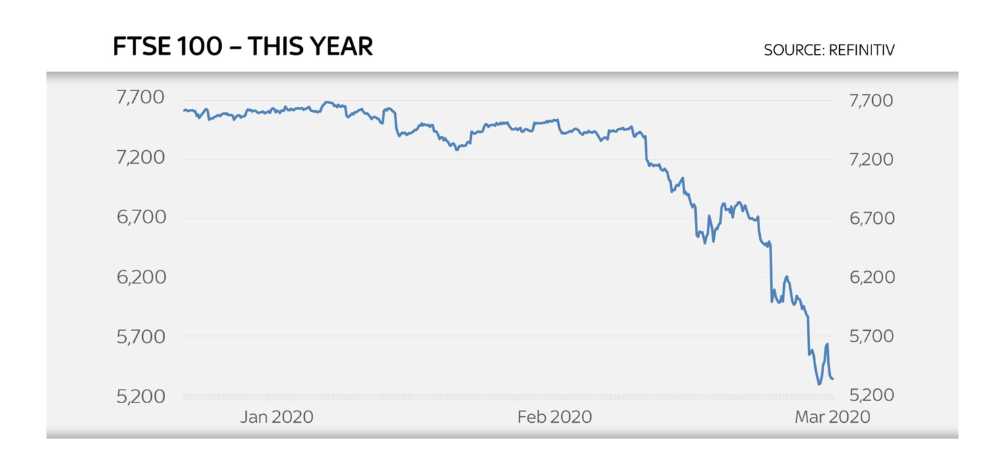
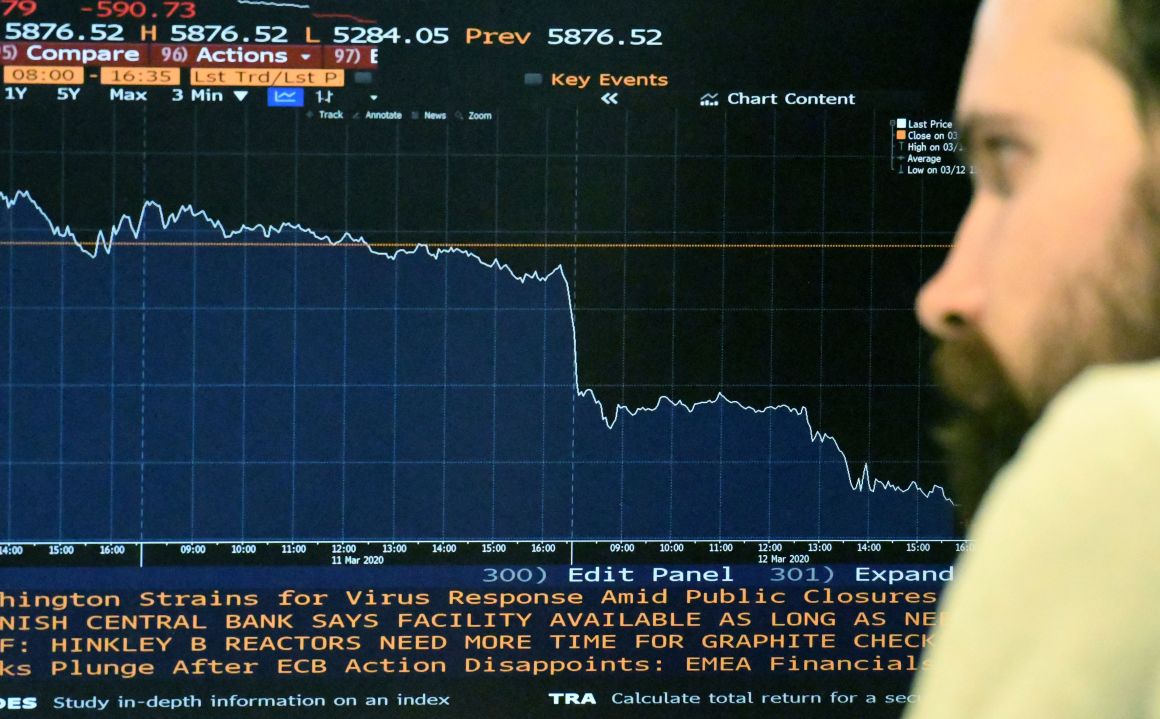
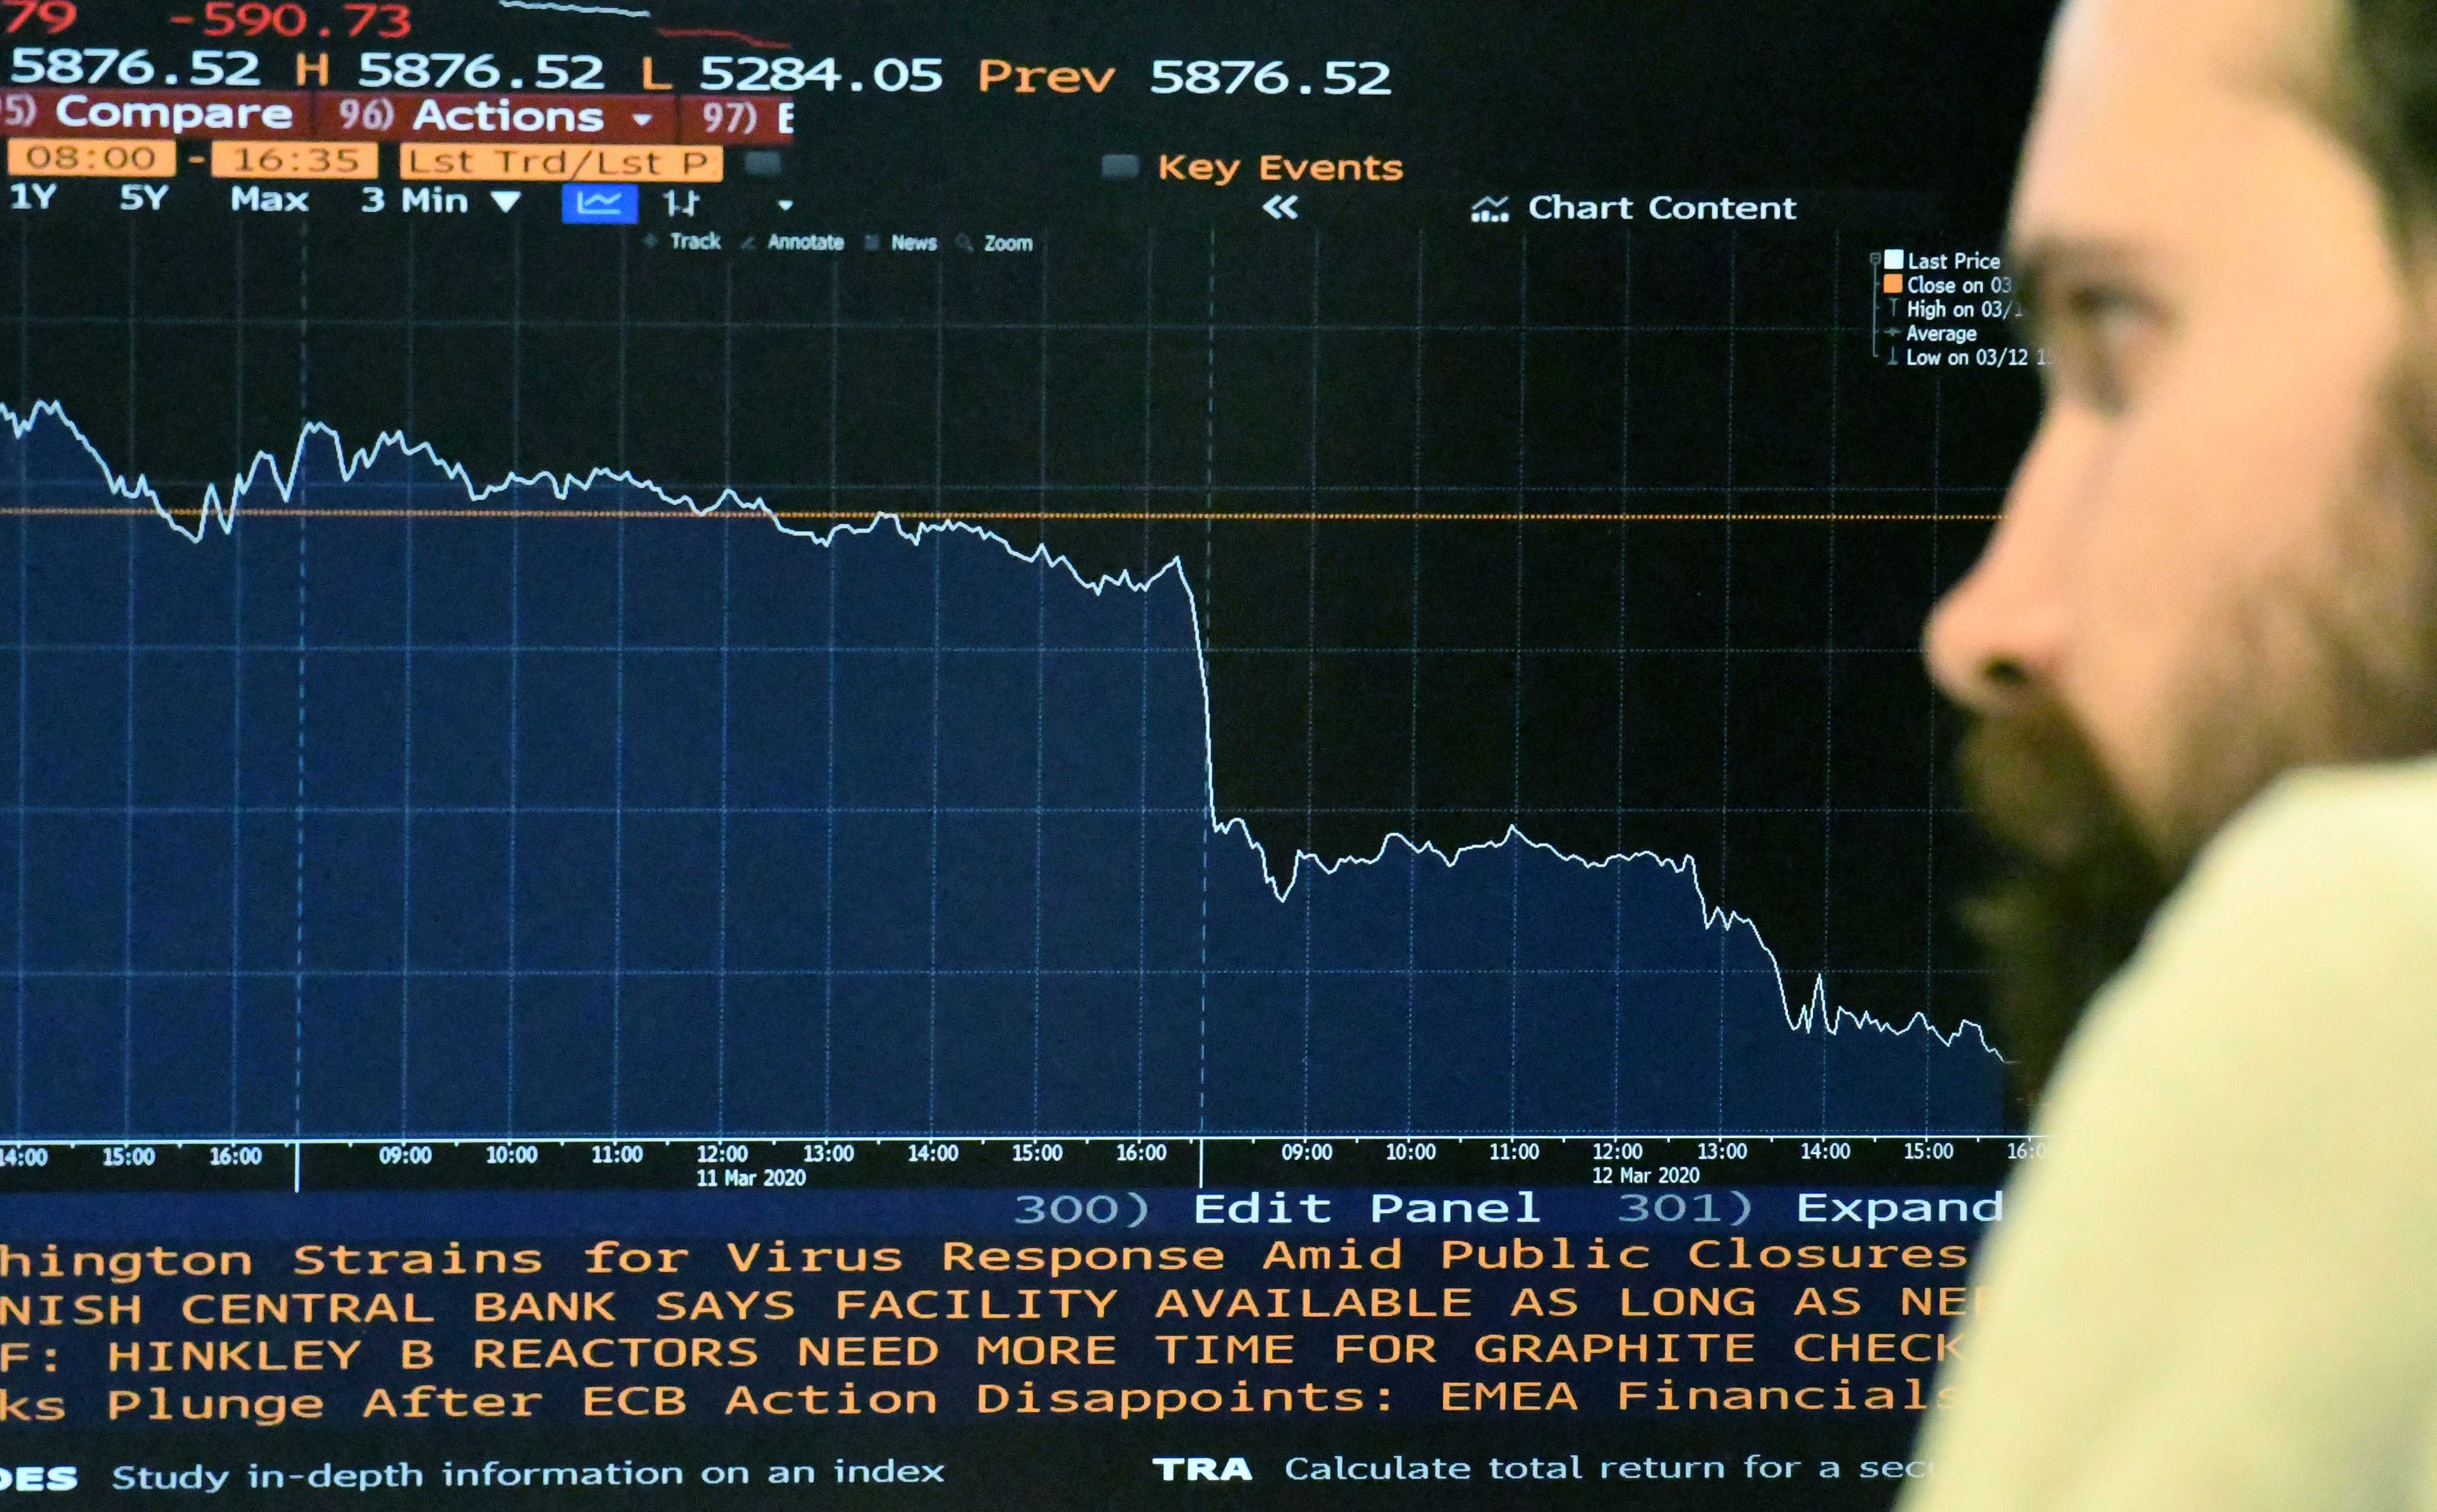
We’ve just seen one of the worst weeks in stock market history, with the FTSE100 ending on Friday 17 per cent down and billions of pounds wiped off British share values. This has been spurred on not by the fear of Covid-19 itself, but by the reaction to the virus: when sentiment switches from confidence to caution, panic can be self-reinforcing.
In response to the panic, the Bank of England slashed interest rates to 0.25 per cent; hours later, Chancellor Rishi Sunak used his first Budget to respond with a £30 billion stimulus package – the biggest giveaway of any Budget since 1992. In reality just £12bn of the £30bn is for the virus disruption: the rest is a debt-fuelled stimulus. But Covid eclipses all.
Below are seven graphs which sum up an extraordinary week of economic news:
FTSE 100 tumbles
There have been few weeks like this one…

(Source: Sky News)
Covid-19 hasn’t just stopped people and goods from crossing borders, but money too.

Britain’s best politics newsletters
You get two free articles each week when you sign up to The Spectator’s emails.
Already a subscriber? Log in


Comments
Join the debate, free for a month
Be part of the conversation with other Spectator readers by getting your first month free.
UNLOCK ACCESS Try a month freeAlready a subscriber? Log in